Fundamental Analysis: Evaluating a Company’s Financial Strength
October 15, 2026 | By GenRPT Finance
Fundamental analysis is the process of evaluating a company’s financial health, business performance, competitive position, and future earnings potential to determine its underlying value. It helps investors understand whether a company has the financial strength to sustain operations, fund growth, manage debt, and generate long-term shareholder returns.
A company’s share price reflects market expectations, but its financial statements reveal what is happening inside the business. Revenue growth may appear attractive, yet declining margins, increasing debt, or weak cash flow could indicate underlying financial pressure. Similarly, a company experiencing temporary earnings weakness may still possess strong fundamentals and attractive long-term prospects.
For investment analysts, asset managers, and portfolio managers, fundamental analysis provides a structured framework for examining these differences. It combines financial statement analysis, profitability assessment, cash flow evaluation, financial ratios, industry comparisons, and business quality analysis to support informed investment decisions.
This guide explains how analysts evaluate a company’s financial strength, which financial metrics matter most, and how fundamental analysis contributes to equity research and investment valuation.
What Is Fundamental Analysis?
Fundamental analysis is an investment research method used to assess a company’s intrinsic value by examining its financial performance, business characteristics, management decisions, and economic environment.
The objective is to determine what a business is worth based on its ability to generate future earnings and cash flows.
Unlike technical analysis, which focuses primarily on historical price movements and trading patterns, fundamental analysis examines the economic and financial factors influencing company performance.
Analysts typically evaluate three areas:
- Financial fundamentals: Revenue, profitability, cash flow, assets, liabilities, and financial ratios.
- Business fundamentals: Competitive advantages, management quality, customer relationships, and operating efficiency.
- External fundamentals: Industry conditions, interest rates, inflation, regulations, and economic growth.
Together, these factors help analysts estimate intrinsic value and assess the risks associated with an investment.
Why Financial Strength Matters in Fundamental Analysis
Financial strength indicates whether a company can meet its obligations, maintain operations, invest in growth, and withstand unexpected business challenges.
A financially strong company generally has sufficient liquidity, manageable debt, sustainable profitability, and reliable cash generation.
However, financial strength cannot be determined using a single metric.
For example, a business may report high net income but struggle to collect payments from customers. Another company may carry substantial debt but generate enough predictable cash flow to comfortably service its obligations.
Analysts therefore examine how different financial indicators interact.
The central questions include:
- Can the company meet its short-term obligations?
- Is the business consistently profitable?
- Does it generate enough cash to support operations?
- Are debt levels sustainable?
- How efficiently does management use capital?
- Can the company maintain financial stability during economic downturns?
The answers form the foundation of a company’s financial health assessment.
Understanding the Three Financial Statements
Financial statement analysis is the starting point for evaluating company fundamentals.
The income statement, balance sheet, and cash flow statement provide different perspectives on business performance.
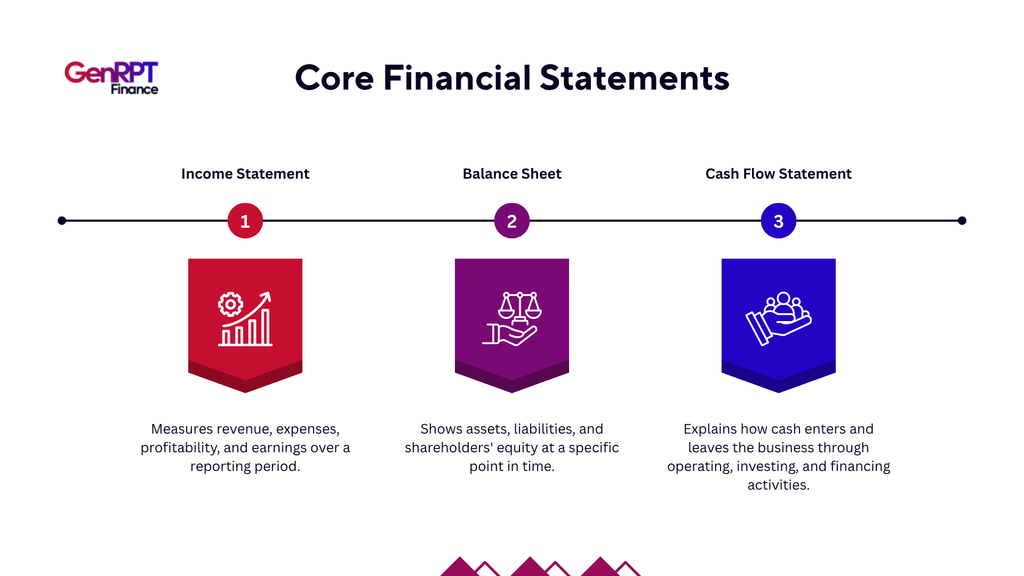
These statements must be evaluated together. Strong earnings do not necessarily indicate strong cash generation, and a healthy balance sheet does not automatically mean a company is operating efficiently.
1. Revenue Analysis: Understanding Business Growth
Revenue represents the income generated through a company’s primary business activities.
Analysts begin by examining historical revenue growth to understand whether demand for the company’s products or services is expanding.
However, the growth rate alone provides limited information.
A company reporting 20% annual revenue growth may appear financially strong, but analysts must determine what is driving that increase.
Revenue growth can result from higher sales volumes, increased prices, acquisitions, geographic expansion, or changes in product mix.
These sources have different implications for future performance.
For example, growth driven by recurring customer demand may be more predictable than growth resulting from a one-time acquisition.
Analysts also examine revenue concentration. A company that depends heavily on a few customers may face greater financial risk than one with a diversified customer base.
Key revenue indicators include:
- Year-over-year revenue growth
- Organic revenue growth
- Revenue by business segment
- Geographic revenue distribution
- Customer concentration
- Recurring versus non-recurring revenue
The objective is to understand the sustainability and quality of revenue rather than focusing exclusively on its growth rate.
2. Profitability Analysis: Measuring Earnings Strength
Profitability analysis determines how effectively a company converts revenue into earnings.
A business may generate substantial sales but create limited shareholder value if operating costs consume most of its revenue.
Analysts examine several profitability measures.
Gross Profit Margin
Gross profit margin measures the percentage of revenue remaining after deducting the direct cost of goods or services sold.
A consistently high gross margin may indicate pricing power, efficient production, or a favourable product mix.
Operating Profit Margin
Operating margin evaluates profitability after accounting for operating expenses.
It helps analysts understand how efficiently the company manages its core business.
Net Profit Margin
Net profit margin measures the percentage of revenue remaining after all expenses, interest, and taxes.
Analysts compare profitability across several years and against industry peers.
A declining margin may indicate rising costs, competitive pressure, or weaker pricing power. Improving margins may reflect operational efficiency, economies of scale, or stronger product positioning.
Importantly, profitability expectations differ across industries. Software companies, manufacturers, retailers, and financial institutions operate with different cost structures.
3. Cash Flow Analysis: Assessing Financial Sustainability
Cash flow analysis is essential because accounting profits do not always translate into available cash.
Under accrual accounting, companies can recognize revenue before receiving payment. Consequently, reported earnings may increase even when cash collection remains weak.
Analysts focus on three cash flow categories.
Operating cash flow measures cash generated through core business operations. Consistently positive operating cash flow indicates that the business can support its activities through internal cash generation.
Investing cash flow includes spending on equipment, property, acquisitions, and other long-term investments.
Financing cash flow reflects activities involving debt, equity, dividends, and share repurchases.
One of the most important metrics is free cash flow.
Free cash flow helps analysts evaluate how much cash remains after funding capital investments.
Consider two companies reporting identical net income. Company A consistently converts most of its earnings into operating cash flow, while Company B reports increasing receivables and weak cash collection.
Although their accounting profits are similar, Company A may possess stronger financial fundamentals.
Analysts investigate such differences before drawing conclusions about earnings quality.
4. Balance Sheet Analysis: Evaluating Financial Stability
The balance sheet reveals how a company finances its operations and manages its financial obligations.
Analysts examine the relationship between assets, liabilities, and shareholders’ equity.
Assets include cash, receivables, inventory, property, and investments. Liabilities include supplier payments, borrowings, lease obligations, and other financial commitments.
A financially stable company should maintain an appropriate balance between resources and obligations.
Important areas of balance sheet analysis include:
- Cash and cash equivalents
- Short-term and long-term borrowings
- Accounts receivable
- Inventory levels
- Working capital
- Shareholders’ equity
- Debt maturity schedules
Analysts also review notes to the financial statements for contingent liabilities, guarantees, lease commitments, and other obligations that may affect financial flexibility.
Balance sheet strength becomes particularly important during periods of economic uncertainty, when access to external financing may become more expensive or restricted.
5. Liquidity Ratios: Can the Company Meet Short-Term Obligations?
Liquidity ratios help analysts determine whether a company can meet its immediate financial commitments.
The current ratio is commonly used.
A current ratio above 1 generally indicates that current assets exceed current liabilities, although an appropriate level depends on the industry and business model.
The quick ratio provides a more conservative assessment by excluding inventory and certain other less-liquid current assets.
Liquidity analysis is especially relevant for companies with seasonal sales, large inventory requirements, or significant short-term borrowings.
Analysts also assess the timing of cash receipts and payments because liquidity problems can emerge even when accounting ratios appear acceptable.
6. Solvency Analysis: Understanding Debt and Financial Risk
Solvency analysis focuses on a company’s ability to meet long-term financial obligations.
Debt can support business expansion, acquisitions, and infrastructure investment. However, excessive borrowing increases interest expenses and reduces financial flexibility.
One widely used metric is the debt-to-equity ratio.
Analysts also examine net debt, debt-to-EBITDA, and interest coverage.
Higher interest coverage generally indicates a greater ability to meet financing costs through operating earnings.
However, acceptable leverage varies considerably across industries.
Utilities may sustain relatively high borrowing because of predictable cash flows, while cyclical businesses may face greater risks with similar debt levels.
Analysts therefore evaluate debt alongside earnings stability, cash generation, refinancing requirements, and prevailing interest rates.
7. Return Ratios: Measuring Capital Efficiency
A company may be profitable without using its capital efficiently.
Return ratios help analysts determine how effectively management generates earnings using shareholder funds and invested capital.
Return on Equity (ROE)
ROE measures profitability relative to shareholder equity.
However, high ROE can sometimes result from excessive financial leverage rather than superior operating performance.
Return on Invested Capital (ROIC)
ROIC evaluates how efficiently a company generates operating profits from invested capital.
Analysts often compare ROIC with the weighted average cost of capital (WACC).
When ROIC consistently exceeds WACC, the company is generally creating economic value through its investments.
Sustained returns above the cost of capital can indicate strong business fundamentals, disciplined management, and competitive advantages.
8. Working Capital Management and Operating Efficiency
Working capital analysis examines how efficiently a company manages its day-to-day operating resources.
A business may generate healthy revenue and profits but experience cash flow pressure because customers take longer to pay or inventory remains unsold.
Analysts review the cash conversion cycle, which measures the time required to convert operating investments into cash.
Where:
- DIO represents days inventory outstanding.
- DSO represents days sales outstanding.
- DPO represents days payable outstanding.
A shorter cash conversion cycle generally indicates more efficient working capital management, although the ideal cycle depends on the business model.
For retailers and manufacturers, inventory management is particularly important. For service businesses, receivables and customer payment terms may be more relevant.
Changes in working capital can also explain why earnings and cash flow move in different directions.
9. Earnings Quality: Are Reported Profits Reliable?
Earnings quality evaluates how accurately reported profits reflect sustainable business performance.
Two companies may report similar earnings growth while having significantly different earnings quality.
Analysts investigate factors such as revenue recognition, non-recurring gains, accounting adjustments, provisions, and changes in accounting policies.
They also compare net income with operating cash flow.
Warning signs may include:
- Profits increasing while operating cash flow declines
- Receivables growing faster than revenue
- Repeated exceptional gains
- Frequent accounting policy changes
- Unexplained margin improvements
- Significant differences between adjusted and reported earnings
These indicators do not automatically establish financial misreporting. They signal areas requiring further investigation.
High-quality earnings are generally supported by recurring operations, transparent accounting, and reliable cash conversion.
10. Comparing Financial Strength Across Industry Peers
Financial ratios become more useful when analysts compare them with appropriate benchmarks.
For example, a company with a 12% operating margin may outperform competitors in a low-margin industry but underperform peers in a high-margin sector.
Peer benchmarking helps analysts identify relative strengths and weaknesses.
Peer selection matters because differences in business models, geographic exposure, accounting practices, and revenue mix can distort comparisons.
Analysts typically examine several years of performance to distinguish temporary changes from structural advantages.
11. Qualitative Factors That Influence Financial Strength
Financial ratios explain much of a company’s historical performance, but qualitative factors influence its ability to sustain that performance.
Management quality is particularly important. Leadership decisions affect capital allocation, operating efficiency, acquisitions, financing, and long-term strategy.
Competitive advantages also influence financial strength.
Companies with strong brands, switching costs, intellectual property, network effects, or cost advantages may be better positioned to maintain margins and generate consistent cash flows.
Other important considerations include customer concentration, supplier dependence, regulatory exposure, corporate governance, and technological disruption.
For example, a company may have excellent current profitability but face significant long-term risk if its core product is becoming obsolete.
Fundamental analysis must therefore connect financial performance with the underlying business environment.
12. How Financial Strength Influences Company Valuation
Evaluating financial strength is an important step in determining a company’s intrinsic value.
Analysts use fundamental analysis to develop assumptions about future revenue, profitability, cash flow, and capital requirements.
These assumptions feed into valuation methods such as Discounted Cash Flow (DCF) analysis and comparable company valuation.
In a DCF model, analysts estimate future free cash flows and discount them to present value using an appropriate discount rate.
A financially strong company may justify more favourable assumptions because of predictable cash generation, lower financial risk, or durable competitive advantages.
However, a financially strong business is not automatically an attractive investment.
The market price must also be considered.
If a company’s shares already reflect overly optimistic growth expectations, investors may face downside risk despite strong fundamentals.
This distinction between business quality and investment attractiveness is central to equity research analysis.
13. How Economic Conditions Affect Financial Fundamentals
Company performance is influenced by broader economic conditions.
Interest rates affect borrowing costs and investment decisions. Inflation influences input costs, pricing, and consumer purchasing power. Currency fluctuations affect businesses with international operations.
Analysts also consider economic growth, employment trends, government policy, and industry-specific developments.
For example, a company with substantial floating-rate debt may experience higher interest expenses when rates rise.
Similarly, a manufacturer dependent on imported raw materials may face margin pressure following currency depreciation.
Financial strength should therefore be evaluated under different economic scenarios rather than assuming current conditions will remain unchanged.
14. Common Mistakes in Fundamental Analysis
Even experienced analysts must avoid drawing conclusions from isolated financial metrics.
One common mistake is assuming that high revenue growth automatically indicates strong financial health.
Another is treating low debt as universally positive without considering whether the company is using its capital efficiently.
Analysts may also overestimate the significance of one strong reporting period or overlook changes in accounting practices.
Other mistakes include relying on outdated financial data, selecting inappropriate peers, ignoring cash flow, and using unrealistic forecasting assumptions.
A reliable fundamental analysis process requires consistent definitions, multiple reporting periods, appropriate industry comparisons, and careful examination of financial disclosures.
15. How AI Supports Fundamental Analysis in Equity Research
Fundamental analysis requires analysts to process substantial amounts of financial information.
Research teams frequently review annual reports, quarterly statements, earnings call transcripts, regulatory filings, and historical financial data.
Much of the initial work involves extracting figures, organizing disclosures, calculating ratios, and comparing reporting periods.
AI can support these activities by reducing repetitive data processing and helping analysts identify financial trends.
For example, automated analysis can highlight changes in operating margins, leverage, working capital, or cash conversion that warrant further investigation.
AI can also support peer benchmarking, financial modelling, scenario analysis, and research report preparation.
However, automation does not eliminate the need for analyst oversight. Financial figures must be verified, assumptions reviewed, and unusual results investigated.
The greatest value comes from combining automated processing with professional financial judgement.
How GenRPT Finance Supports Fundamental Analysis
GenRPT Finance uses Agentic AI to support institutional equity research workflows, including financial statement analysis, peer benchmarking, financial modelling, valuation, and risk assessment.
Its multi-agent approach helps organize different research activities into a coordinated process.
For fundamental analysis, this can reduce the time spent manually preparing financial information and allow analysts to concentrate on interpreting business performance.
GenRPT Finance also supports the generation of comprehensive institutional equity research reports containing financial analysis, valuation findings, tables, charts, and supporting citations.
The platform is designed to assist investment professionals throughout the research process while keeping financial interpretation and investment decisions under human oversight.
Conclusion
Fundamental analysis provides a structured approach to understanding a company’s financial strength and long-term investment potential. It examines profitability, liquidity, solvency, cash generation, capital efficiency, and earnings quality alongside management performance and industry conditions.
A financially strong company should demonstrate more than attractive revenue growth or accounting profits. Its business should generate sustainable cash flows, manage obligations responsibly, use capital efficiently, and remain resilient under changing economic conditions.
For investment analysts and portfolio managers, these findings provide the foundation for financial forecasting, company valuation, risk assessment, and investment thesis development.
AI-supported platforms such as GenRPT Finance can make this process more efficient by automating repetitive research activities and organizing financial information. The final assessment, however, depends on understanding what the numbers reveal about the business and its future prospects.
FAQs
Fundamental analysis evaluates a company’s financial statements, business model, management, competitive position, and economic environment to estimate its intrinsic value and assess investment potential.
Important ratios include operating margin, net profit margin, ROE, ROIC, current ratio, debt-to-equity, interest coverage, and cash flow measures. Their relevance depends on the company’s industry and business model.
Analysts examine profitability, operating cash flow, liquidity, debt obligations, capital efficiency, earnings quality, and financial performance across multiple reporting periods.
Fundamental analysis focuses on a company’s financial performance and intrinsic value. Technical analysis primarily examines market prices, trading volumes, and historical price patterns.
Cash flow indicates whether a company generates enough cash to fund operations, invest in growth, repay debt, and support shareholder distributions. It also helps analysts assess the quality of reported earnings.
Yes. A financially strong company may still be overvalued if its share price already reflects unrealistic expectations. Analysts compare estimated intrinsic value with market valuation before developing an investment conclusion.
AI helps automate financial data extraction, ratio analysis, peer comparisons, trend identification, and research report preparation. Analysts remain responsible for verifying outputs and interpreting financial results.